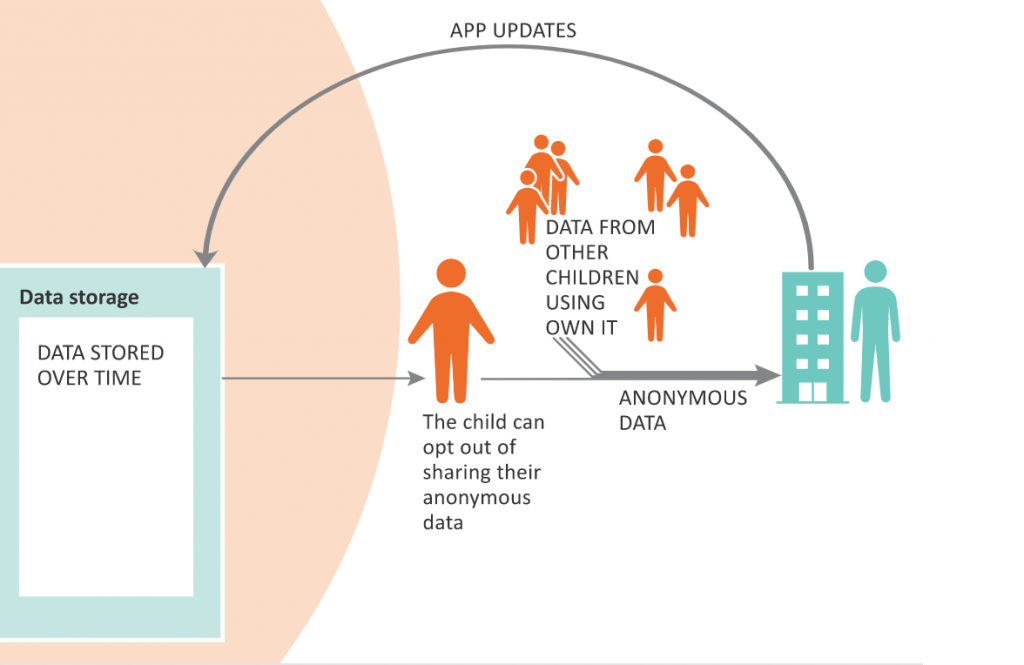
An animation of a data use: Living With Data at the Festival of Social Science
Home >
How is data about us collected, analysed, shared and used? These days, many different kinds of organisations collect and use data about us, but these processes are not always transparent to the general public.

This week, Living With Data has launched an interactive animation as part of the Festival of Social Science that showcases one such process.
Our animation, designed by eyedea studio, brings to life the data processes which take place in Own It: a free app designed by the BBC to support, help and advise children when they use their phones to chat and explore the online world, without adult supervision.
The animation is based on information collected about real life data uses by the Living With Data project. We collected these processes through the ‘Data Journeys’ approach with Lulu Pinney producing visual representations of each data process.
The Own It animation can be stopped at any time while watching and at the end we invite viewers to let us know whether they feel they understand how data is used in Own It, whether they were surprised to find out about it and whether they would be comfortable using Own It themselves (or a child they know using it).
You can find the Own It animation here.
You can read more about the Own It application below:
Howard, J (2019) ‘Own It, The App: Six Technical Challenges’. BBC Blogpost. Available here.
Howard, J (2020) ‘Own It: Wellbeing and Isolation update’. BBC Blogpost. Available here.